Cost Anomaly Detection for Multi-Tenant Agent Platforms
Pinpoint which customer's runaway agent is actually burning your budget.

A cost spike appears on an operator's dashboard, and the bill is up substantially since yesterday. The question is not whether something went wrong. It is which customer's agent caused it. On a multi-tenant agent platform, that answer lives inside a single sandbox, not in a fleet-wide average.
Fleet-level budget alerts tell an operator that a threshold was crossed. They do not say which tenant crossed it or why. Agent workloads are non-deterministic and compositional: a single user interaction can trigger multiple model calls, retries, tool invocations, and orchestration steps. Spend is hard to predict, and harder to cap when aggregated across the whole platform. The unit of accountability is the sandbox. When one tenant's agent misbehaves, the operator needs to know which tenant, not that something spiked.
AI agent observability platforms differ from standard LLM monitoring on exactly this axis. Normal AI monitoring observes outputs. Agent observability explains the chain of decisions that produced the outcome: tool calls, sub-agent handoffs, retrievals, retries. That decision chain is also where cost accumulates. A spike absorbed into an average hides the one sandbox generating it, and makes remediation slow.
The three mechanisms that generate runaway spend inside a single sandbox
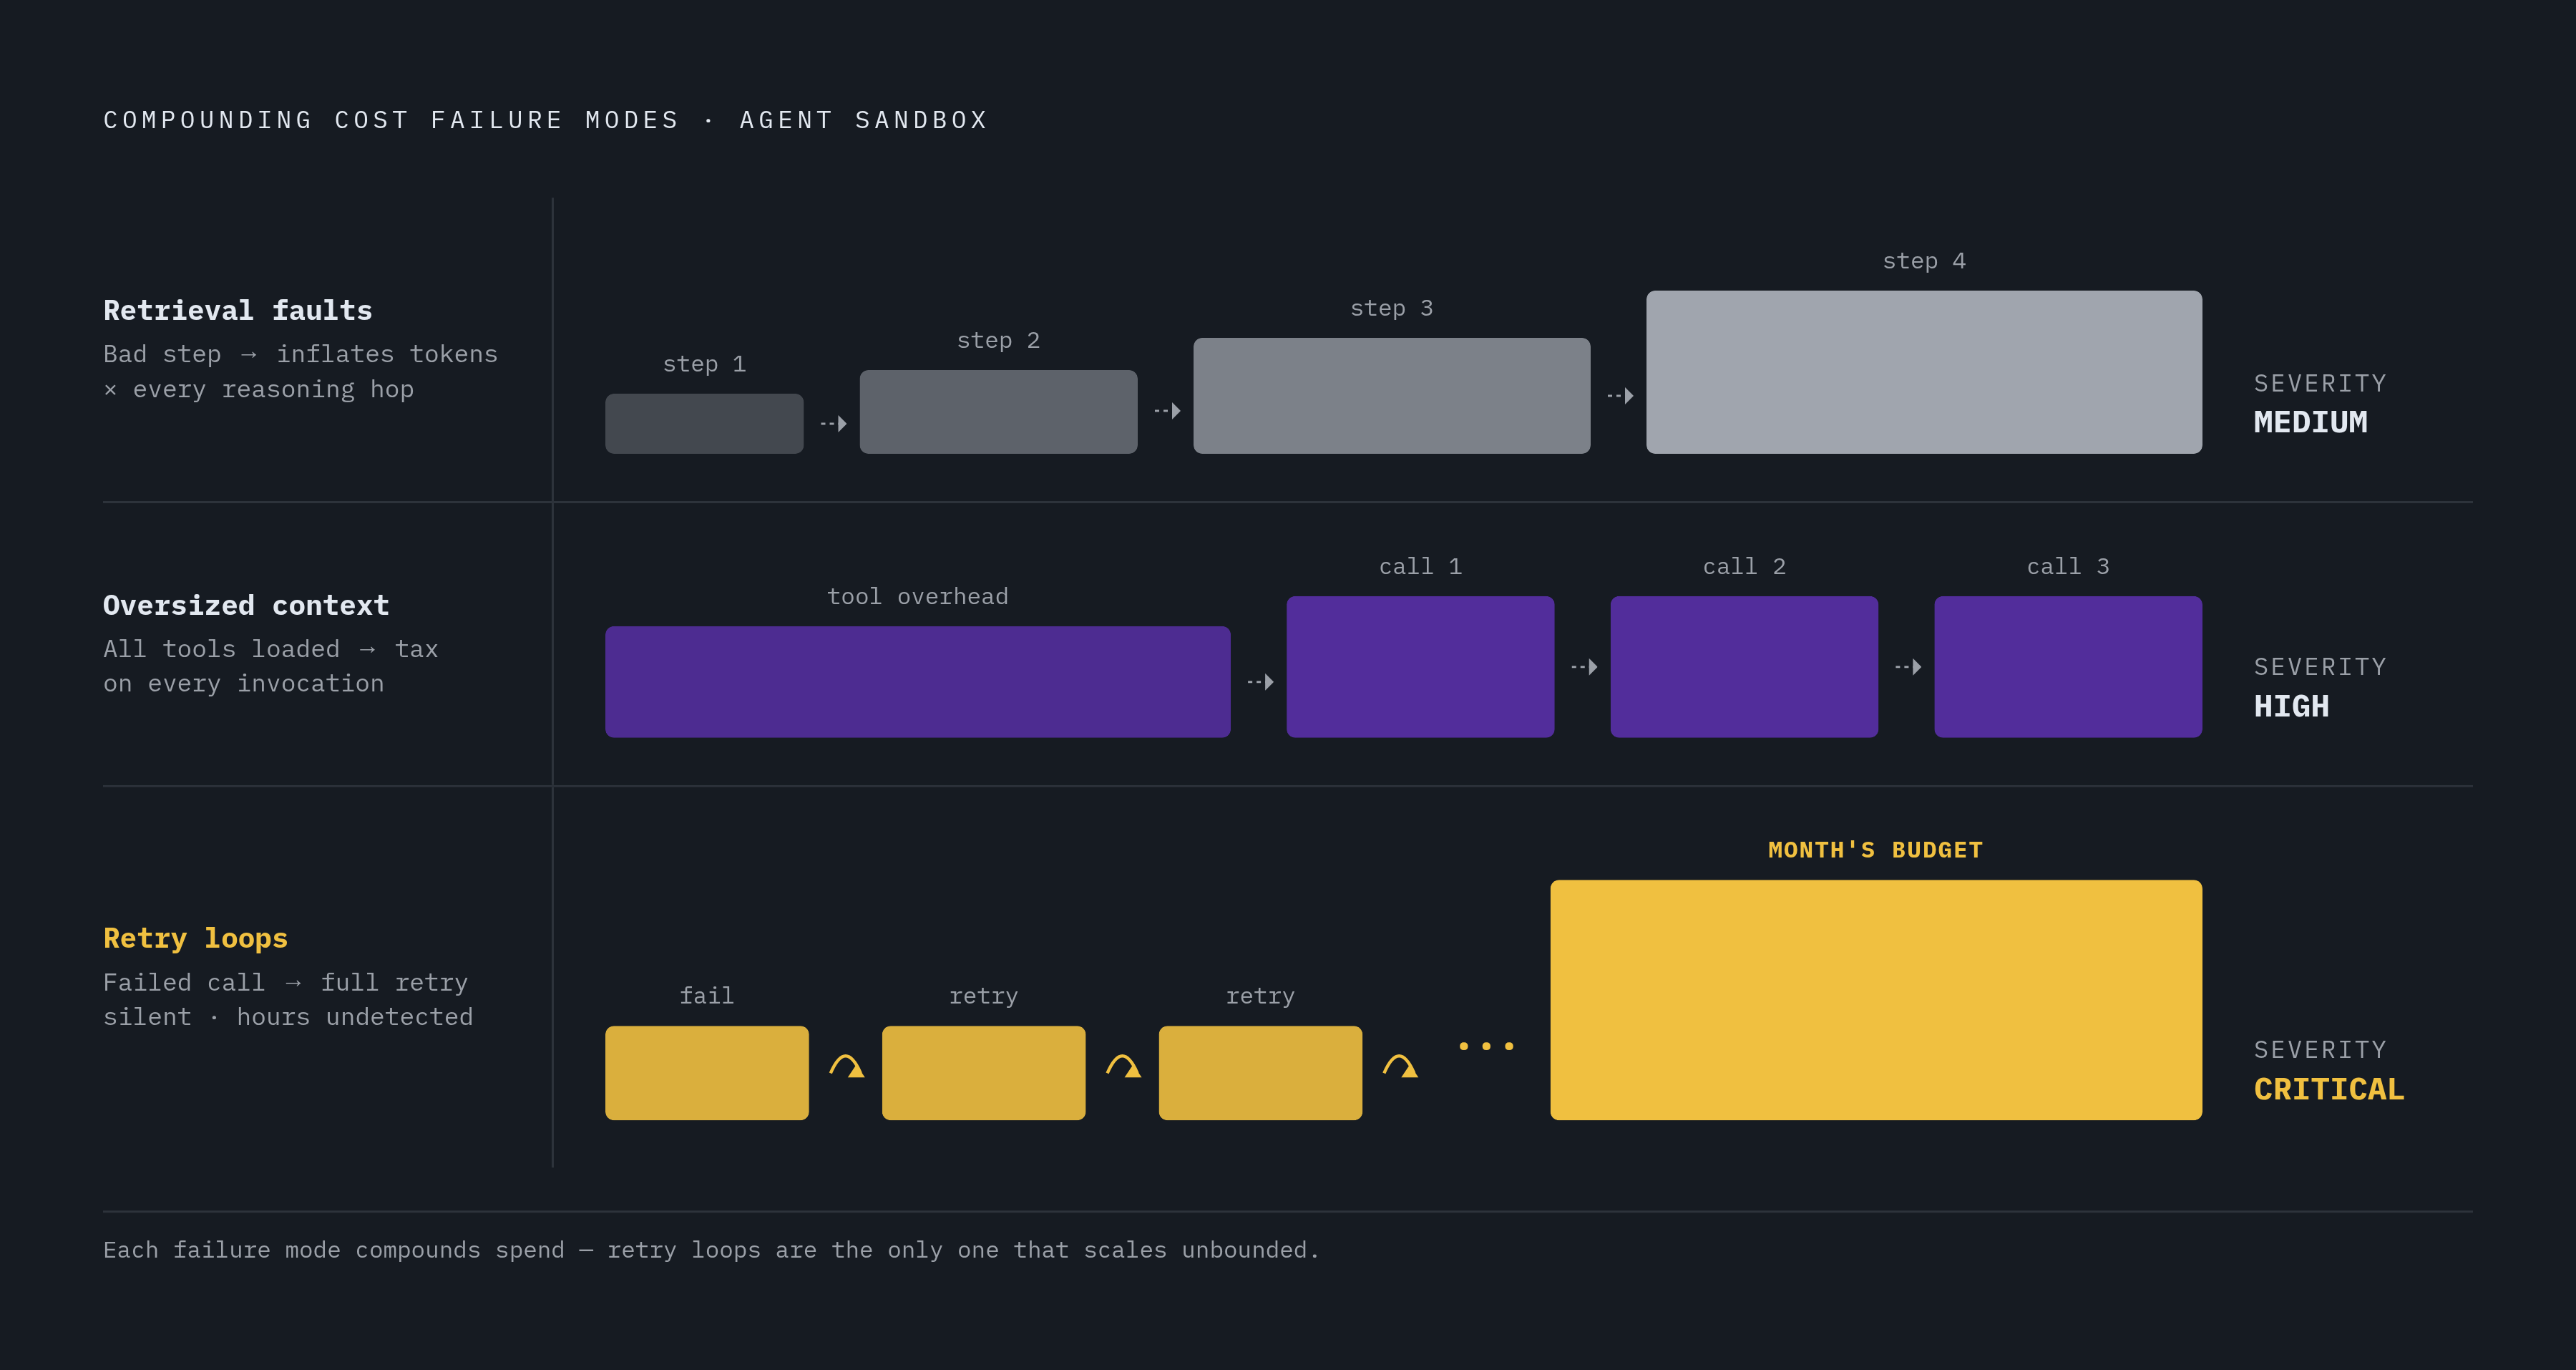
Think of a water bill that has gone up without explanation. You know water is being used somewhere, but without a per-pipe meter you cannot find the leak. Most uncontrolled agent spend traces to three compounding failure modes, and all of them are invisible without trace-level instrumentation.
The first is retrieval faults. A bad retrieval step pulls irrelevant context into the prompt. That inflated token count follows every subsequent call in the chain, so the cost compounds across reasoning steps, not just the single bad call. The second is oversized context windows. Every tool loaded into an agent's context burns tokens on its description alone, before the model does any useful work. That is a direct tax on every invocation. The third is retry loops. When a tool call fails or returns an unexpected result, an agent often retries autonomously. Each retry is a full model call, and a misconfigured agent can loop for hours before any human notices.
Agentic workloads require visibility into the decisions between the user request and the final response: tool selection, tool arguments, retrieval quality, retry counts. That is where cost accumulates. None of them show up at the invoice level.
What trace-level instrumentation must capture to make a sandbox accountable
Detecting those failure modes requires instrumenting every step of the agent's decision chain at the sandbox level. Logging the final response and its token count is not enough. The signals that matter live in the intermediate steps.
A complete trace has to capture every tool call with its name, arguments, and result. Every sub-agent handoff belongs in the trace. Every LLM call should carry the model, input tokens, output tokens, and cost. All of these signals must attach to the same run identifier.
That run identifier must be scoped to the tenant. Without a tenant ID propagated through every span, trace data cannot be aggregated per sandbox or per customer. In multi-agent systems, planners, routers, tools, and sub-agents each have their own prompts. Tool schema versioning belongs in the trace as well. Anomaly detection on agent workloads must be automated. You should not have to query the trace store to see failing runs, timeout spikes, and quality drift.
Per-sandbox spend caps as the first line of defense, not retroactive alerting
A spend cap enforced at the sandbox boundary stops money from moving. An anomaly alert fires after it has already moved. On a multi-tenant platform, that distinction compounds for every active tenant. A misconfigured agent can consume a month's budget in hours. If the alert arrives at hour three, spend has already gone unchecked for two hours.
If you want meaningful hard limits, monitor consumption patterns over time before you set the cap. Premature caps throttle legitimate workloads. Fleet-level budget tools miss the individual tenant causing the spike. The correct unit of enforcement is the same as the correct unit of attribution: the sandbox.
Agent37 implements this principle at the infrastructure level. Every deployed instance, whether an OpenClaw, Hermes, Claude Code, Codex, OpenCode, Grok, or Pi agent, runs in an isolated sandbox with its own enforced spend limit. A runaway agent for one customer cannot affect another customer's budget or the operator's aggregate bill. This is what the design principle looks like when the platform builds it in.
The objection to per-sandbox caps is real. If a bad prompt template hits hundreds of sandboxes at once, you get many individual cap alerts, not one coordinated signal. Fleet-level anomaly detection is the complement, not the replacement. Fleet-level tools identify the systemic cause after the fact.
Tenant-scoped cost attribution: tagging strategies and virtual allocation for untagged spend
Per-sandbox caps prevent runaway spend. Operators also need accurate per-tenant cost reporting for billing, margin analysis, and for identifying chronic over-consumers before they hit a cap. The fundamental attribution problem is that AI spend does not sit in one place. You find it across cloud AI services, direct provider contracts, token-based developer tools, and AI-driven SaaS pricing. Most of it arrives without tenant-level tags.
Cost observability works when it attributes every API request to a team, feature, or customer. Without that granularity, operators are left guessing which workflows or tenants are driving spend. That matters for operators whose agents call OpenAI, Anthropic, Bedrock, or Vertex AI directly, and whose requests arrive without customer identifiers in the metadata. If you want unit economics, cost per active tenant or cost per agent invocation, rather than aggregate spend, you need that layer.
The tagging discipline starts at the agent runtime. Each LLM call the agent makes needs a tenant ID in its metadata. Attribution tools then aggregate correctly without retroactive inference. For platforms designed for multi-tenant agent deployment, tenant IDs must propagate through every span of the trace: tool calls, retrievals, retries, LLM invocations. Cost per inference and cost per tenant are the unit metrics that matter for a multi-tenant operator. They connect usage data to pricing decisions and margin management.
The tooling landscape for anomaly detection on AI agent spend
For the full stack, from trace-level agent observability to cross-cloud cost anomaly detection, no single tool exists. Operators need to understand which layer each tool addresses. Agent37 is the foundational layer. Operators building on its Cloud API get per-user agent sandboxes provisioned with a single API call. The tenant ID, isolation boundary, and spend ceiling are built into the provisioning model, which is the prerequisite for any downstream observability tool to do its job. Agent37's architecture enforces per-sandbox attribution: every deployed agent runs in its own isolated sandbox with tenant-scoped attribution built in, so cost spikes are automatically traceable to the specific customer whose agent generated them.
Confident AI covers the trace-level observability layer. It offers complete trace visibility across tool calls, sub-agent handoffs, retrievals, LLM calls, retries, inputs, outputs, latency, cost, and version. Automated anomaly detection flags failing runs, timeout spikes, and quality drift. It also supports trace-to-dataset loops: risky production traces become evaluation cases for future CI. That matters for operators who want to catch a bad prompt template before it propagates to all tenant sandboxes.
Finout covers the financial allocation layer. Custom anomaly thresholds are definable at any cost dimension, with alerts routed to Slack, email, and Microsoft Teams in real time. All tiers require requesting a quote.
CloudZero provides hourly anomaly detection tied to unit economics and per-feature cost. If you need cost-per-tenant reporting, not just aggregate spend alerts, this is the fit. It is useful for operators who want per-call metering without a full observability platform.
How Composio's tool-routing architecture reduces token burn across tenant sandboxes
Narrowing tool exposure at the integration layer is a direct cost-containment lever. The fewer tool descriptions you load into an agent's context, the fewer tokens you burn on every invocation across every tenant. Tool search lets the agent discover the right action on the fly rather than loading all possible tools into context at startup.
Every tool description in context costs tokens on every model call. Composio handles OAuth 2.0 flows, API keys, and token refresh centrally. The platform holds SOC 2 Type 2 and ISO 27001 certifications. Agent37 integrates Composio natively, so operators deploying agents on the platform inherit the tool-routing architecture without additional configuration.
The fleet-level anomaly detection layer that per-sandbox caps cannot replace
Per-sandbox caps and trace-level instrumentation are necessary but not sufficient. A bad prompt template or a misconfigured integration deployed to many sandboxes simultaneously requires a fleet-level signal. Consider an operator who deploys an updated prompt template to all tenant sandboxes. The new template triggers a retry loop in a specific tool-call path. Every sandbox running the template begins accumulating excess spend at the same time.
Per-sandbox caps fire independently for each affected tenant. Fleet-level anomaly detection sees the correlated spike across sandboxes. It surfaces the event tied to the shared configuration change, reducing mean time to root cause from hours to minutes.
You see cross-resource cost spikes with root-cause context, not just per-instance threshold alerts. Fleet-level tools need the same tenant-scoped tagging discussed in the attribution section. If tenant IDs are missing from every call, fleet-level patterns are indistinguishable from aggregate noise. The correct architecture is both layers with defined responsibilities. Per-sandbox caps prevent damage in real time. Fleet-level detection identifies systemic causes for remediation and policy changes.
Governance and security controls that belong alongside cost anomaly detection
The instrumentation required for cost anomaly detection, per-sandbox traces, tool-call logs, tenant-scoped attribution, is the same instrumentation that supports security enforcement and compliance auditing. The two concerns are inseparable in practice. If MCP server installation bypasses central authentication, you get cost blind spots from unknown token consumption, plus security and compliance gaps. The authentication discipline that closes the cost blind spot closes the security gap.
Runtime enforcement blocks bad tool calls before they execute, but that is not cost anomaly detection. But it operates on the same trace data. A multi-tenant platform needs both, and the trace infrastructure for cost visibility can feed both. Agent37's sandbox isolation is the infrastructure-level expression of this. Its architecture uses gVisor enforcement, a per-sandbox filesystem, and firewalled egress. Tenants cannot see each other. Egress is restricted per sandbox to the public internet only, not the host, not private networks. That eliminates the cross-tenant attack surface that shared infrastructure creates. SOC 2 audit trails, access reviews, and incident response documentation can be generated from the same trace and event logs that feed cost anomaly detection.
What operators must build versus what managed infrastructure handles for them
The instrumentation and enforcement architecture in this piece is non-trivial to build and maintain. Deciding which layers to own versus delegate determines how much of a founder's time goes to infrastructure versus product. Certain work belongs to the operator regardless of platform. Tenant-scoped tagging on every LLM call, baseline consumption profiles per sandbox, anomaly thresholds calibrated to each tenant's workload, and escalation paths that connect a cost alert to the right customer record are all in that category. Managed infrastructure can handle sandbox isolation, per-instance spend ceilings, uptime monitoring, security patching, SOC 2 compliance artifacts, and integration authentication. All require ongoing engineering attention when self-hosted.
The hidden cost of self-hosting does not appear in compute invoices. Provisioning, monitoring, and recovering one isolated agent per customer means VPS setup, Docker configuration, SSH access management, health checks, and restart policies. Per-user agent isolation is the right architectural unit for scaling an agent-powered business, so spend controls should be enforced at the sandbox boundary. Each customer's agent should have its own hard cap, automatically enforced before a runaway agent can consume a month's budget in an afternoon.
Agent37's one-click deployment and Cloud API model removes that operational layer. Operators provision a per-tenant sandbox with a single API call. The platform handles uptime, billing controls, security, and recovery. The Boon case illustrates the model: one client equals one API call, returning an always-on Hermes agent holding that client's data, that client's identity, and a hard ceiling on what it can spend. Tenant isolation, spend cap, and authentication are provisioned automatically, not hand-configured. The operator's remaining work is instrumentation for cost attribution and anomaly detection at the application layer, which only they can do. The goal is not to eliminate all cost anomaly risk. It is to push the enforcement boundary as close to the sandbox as possible, delegate the infrastructure layer to a platform that has solved it, and concentrate custom engineering on the attribution and detection logic that reflects the operator's specific business model.