Concurrency Limits and Queue Design for Per-User Agents
Agent workloads demand isolation and queue design upfront, not rate-limit tuning after launch.
Advertisement
A chatbot's workload scales with the number of messages a person sends. An agent's workload scales with tasks times steps per task, and that difference changes everything about how you build the system underneath it. This piece walks through why concurrency limits and queue design aren't a tuning knob you turn after launch. They're the foundation. Get them wrong and the product stays unfair, unstable, and financially unpredictable no matter how good the model is.
An easy task on a given platform might take a handful of model calls. A hard one on the same platform, same user, same day, might take many times that. The gap is not a rounding error but a full order of magnitude, arising because agents plan, call tools, re-plan, summarize, and retry, often in loops that don't resolve cleanly. One click from a user can fan out into dozens of LLM calls, tool calls, and retries, some sequential, some parallel. The real request rate a system generates is tasks per minute times average steps per task times a retry multiplier. Most teams only track the first number, tasks per minute, right up until an outage or a bill that doesn't make sense lands on someone's desk.
That's the trap: rate-limit-by-user and throttle-by-message are ideas borrowed from web APIs and chatbots, and they don't hold up here. An agent needs per-task budget caps and loop guards on top of the usual rate-limit machinery, because the usual machinery was built for a world where load tracked messages, not compounding steps. Agentic tools have moved from a niche experiment to something a large and growing share of professional developers now use daily, and the market behind them has grown into a large and rapidly expanding category. This is now a common case. It's a mainstream engineering problem, and it deserves mainstream engineering discipline.
How a single misbehaving agent can take down every other user on the platform
Picture a coding agent that gets stuck re-planning the same failed step, over and over, overnight. By morning it can burn through a large chunk of an API key's budget while the usage dashboard shows almost every request coming back as a rate-limit error. If several agents share that same key, one bad actor starves all the others. This risk sits beyond a hypothetical scenario in some postmortem doc somewhere. It's a recurring event in production systems that don't isolate load.
The failure doesn't fix itself, either. Rate limit errors compound: an agent hits a 429, retries, the retry adds more load, and the whole system slides into backoff failure, where everyone is retrying and nobody is succeeding. And the ugly part is how invisible this looks in normal monitoring. CPU isn't pegged. Median latency looks fine. But the tail of the latency distribution is climbing, queues are growing, and nobody's paged yet because the dashboards weren't built to catch it.
Worse, a rate-limit error can look like a logic bug from the agent's point of view. It receives a synthetic error message it was never trained to handle, and instead of failing cleanly, it might try some workaround that produces a wrong answer instead of an honest failure. In a compliance-sensitive setting, a hallucinated result caused by a rate-limit gap can cost far more than the API charge that triggered it ever would. Per-user and per-agent isolation is a core requirement built in from the start. It's the foundational decision everything else sits on.
The three-layer client-side control stack: token buckets, semaphores, and priority queues
Raw agent code should never talk to a model provider directly. Put a control layer in between, and build it in three parts.
Token bucket. This smooths bursts down to a sustained rate. Set it a bit below the provider's actual limit, not right up against it, so there's headroom left when retries start piling up.
Semaphore, or concurrency cap. A semaphore is just a counter: it tracks how many execution slots are currently in use. A task grabs a slot before it starts and gives it back when it's done. Unbounded parallelism under load amplifies latency and makes the whole system harder to reason about, while a fixed worker pool behaves in ways you can actually predict. Start small, single digits to the low teens of concurrent LLM calls per provider key, and raise the number gradually while watching error rates and token usage. For many accounts, the tokens-per-minute ceiling becomes the binding constraint before raw concurrency does. The exception is streaming calls, which hold a connection open for a long stretch and eat into your effective concurrency faster than the raw math suggests.
The right number depends on the work. CPU-bound tasks should stay close to your core count. I/O-bound and API-bound tasks can run higher, as long as you respect the provider's rate and connection limits. Mixed workloads should start conservative and get tuned against real metrics, not guesses.
And if you're running multiple processes or hosts, each process has its own semaphore, so total concurrency is per-process limit times number of processes. That has to be coordinated with your queue design, or aggregate traffic quietly blows past what the provider allows even though each process thinks it's behaving.
Priority queue. When demand outstrips capacity, interactive user tasks need to jump ahead of background or batch jobs. Nobody wants to wait behind someone else's overnight report.
One rule sits above all three layers: rate limiting has to be centralized per provider key, in one gateway process or a distributed bucket if you're running multiple hosts. Per-agent limiters don't talk to each other, so even if each one looks fine in isolation, the aggregate can still blow through the org-level limit. And always pair the semaphore with timeouts and task deadlines. A hung task holds its slot forever unless there's a per-call timeout and a job that goes looking for stale tasks. Release the slot in a finally block, always, so it can never leak.
Separating orchestration from tool execution with a durable queue
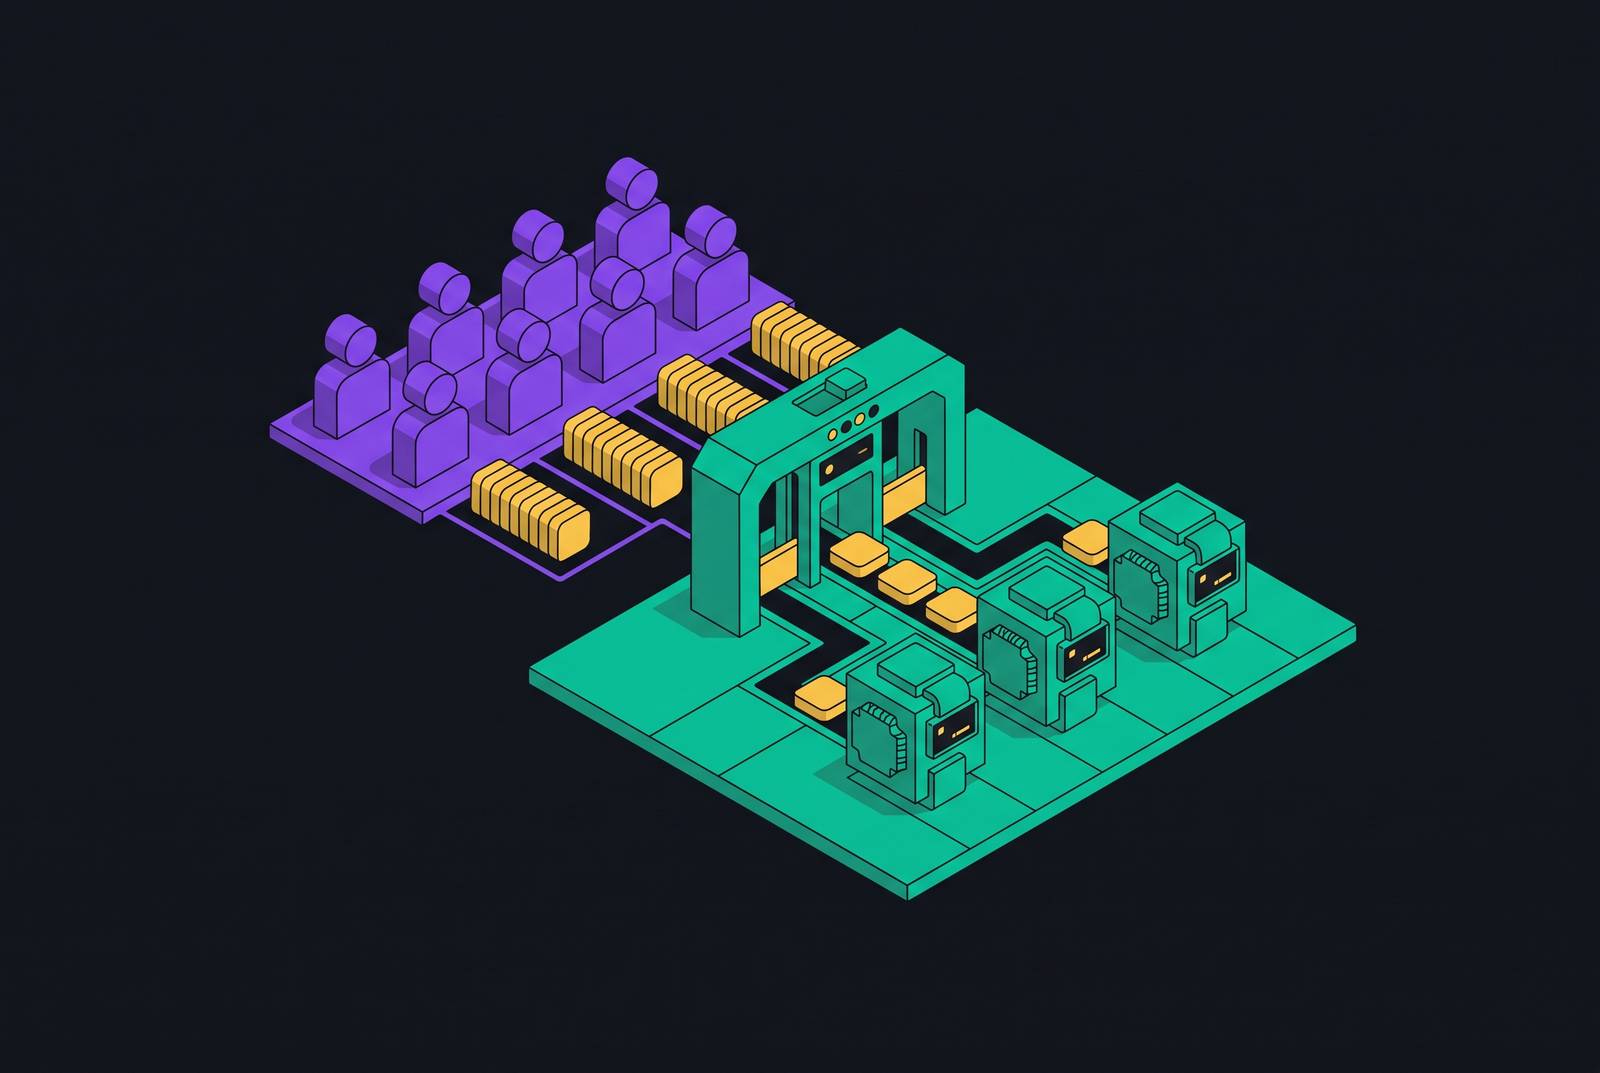
There's a natural seam in an agent system: the orchestration loop, which calls the model and decides what to do next, and tool execution, which actually does the work. Put a durable queue between them. A slow or failing tool call shouldn't stall the whole agent loop for every user waiting on it, and the two components have different load shapes anyway. They shouldn't share an autoscaler.
A common stack looks like this: a FastAPI orchestrator, a provider API in the Responses API style, Redis Streams as the tool-execution queue, and a gateway handling auth and rate limiting. Redis Streams, and durable queues like it, can handle far more throughput than any realistic agent workload will produce, so the queue itself isn't your bottleneck. Use consumer groups rather than plain pub/sub if losing a tool result during a broker failover isn't something you can shrug off. Scale the orchestrator on request concurrency. Scale the tool workers on queue depth. Different signals, different autoscaling policies, and conflating them is how you end up scaling the wrong thing during an incident.
Rate-limit at your own gateway before the provider's 429 ever has a chance to fire. Users deserve a fast, clear answer before the provider throttles them, not a slow timeout. And track the provider's rate-limit response headers directly, the ones reporting remaining requests and remaining tokens, rather than guessing your headroom from past behavior. Those headers give you a real-time signal on how close you are to a 429.
Here's the honest counterargument, though: most agent workloads never see traffic that justifies any of this. If it's internal tooling, a small customer base, or anything under a few dozen concurrent sessions, a single process calling the provider directly is simpler to build, deploy, and debug. The moment you split orchestration from execution, distributed tracing becomes mandatory, because without it, whoever's on call loses all visibility into where a request actually got stuck. Async queues bring their own failure modes too: consumer-group rebalances, duplicate tool executions, sessions that go stale and nobody notices. The fixed cost of running a Redis cluster and multiple orchestrator replicas can outweigh what a simpler pay-per-call setup costs for workloads that are bursty but genuinely low-volume.
This architecture earns its complexity when predictable tail latency across many concurrent sessions actually matters to the business. It's not something to reach for on day one. And for what it's worth, the most common incident in agent tool calling isn't a bad model response, it's a cascading timeout: an orchestrator sitting there, blocked, waiting synchronously on a tool call that never comes back.
Setting explicit concurrency ceilings per node before anything else
The real ceiling on agent throughput is the memory layer. It's the provider's concurrency limit and how many worker pods you're running. Full stop.
Unbounded fan-out, an orchestrator spawning workers on a single node without any per-node cap, is the most common way teams run out of worker pool memory in their first few weeks of production. Set an explicit ceiling on concurrent agents per node before touching anything else. This one setting decides whether overload gets absorbed gracefully or cascades into an outage.
Streaming calls to frontier models can hold a connection open for a long time, which means the effective concurrency ceiling sits lower than what the raw requests-per-minute math implies. And that node-level cap has to line up with the semaphore configured in the application layer. If the two aren't coordinated, whichever number is smaller quietly determines actual behavior, usually in a way nobody planned for.
At the edge, when work can't be accepted, say so. Return a clear rate-limit or service-unavailable response with a retry hint, rather than queuing the request indefinitely. Queuing forever just hides the overload instead of surfacing it, and hidden overload is the kind that turns into a 3 a.m. page.
Budget guards and kill switches alongside concurrency controls
Rate limits protect availability. Budget guards protect cost. Those are two different jobs, and a system needs both.
Layer the budget guards at several levels: per-task, per-user, per-feature, and org-wide.
- Per-task token cap. Hit the ceiling, and the task terminates and checkpoints rather than running forever.
- Per-task dollar cap. Interactive and batch workloads should carry separate limits, since they tolerate delay and urgency differently.
- Per-user daily cap. This should track the plan someone's on. Soft-block and show an upgrade path, don't just fail silently and leave someone wondering why their agent stopped responding.
- Org-level kill switch. A flag checked at the gateway, flippable in under a minute, that halts all non-critical agent traffic once spend crosses some multiple of expected daily spend.
Cost has to get computed incrementally, on every single API response, not tallied up after the fact. Token counts come back with every response. Multiply by price, accumulate on the task record, and overruns get caught while they're happening instead of showing up as a surprise on the invoice.
The kill switch needs to be a tested code path, something exercised in advance, not a dashboard someone glances at occasionally. Teams that treat it as a manual intervention find out it doesn't actually work during the incident, which is the worst possible time to learn that. And this isn't rare: nearly every agent team runs into a runaway-cost incident in its first several months of production, with the damage ranging anywhere from a few hundred dollars to tens of thousands.
Some of the best cost control happens before the guardrails ever kick in. Structure prompts so static content comes first, so provider-side prompt caching actually works. Route anything non-interactive to batch APIs. Spread load across multiple providers for failover. None of that replaces budget guards, but it shrinks the footprint those guards have to police.
Fairness across users: why per-user isolation is the right unit of scale
A shared concurrency pool sounds efficient until one heavy user eats the slots another user's interactive task needed. Keeping the system stable and keeping it fair to every user are not the same problem, and solving one doesn't solve the other.
The priority queue described earlier is really the fairness mechanism here: interactive tasks need to be able to preempt background jobs, whether those jobs belong to the same user or a lower-priority task from someone else entirely. On top of that, multi-tenant fairness needs per-user or per-tenant quotas layered over the global concurrency controls. The global controls keep the whole system from collapsing. The per-user quotas keep any one customer from soaking up more than their fair share.
Per-user or per-tenant isolation at the execution layer, rather than just in shared accounting, is the right unit of scale. It kills cross-user interference at the execution layer itself, not just in the accounting spreadsheet that tracks rate limits. Partitioning worker capacity so one tenant's load can't consume resources everyone else depends on is isolation at the scheduling level, not just at the login screen.
Sandbox boundaries are what actually make the isolation real. Concurrency controls assume it exists, but without execution-level isolation, a runaway agent can still chew through host resources even if its API slot usage looks capped on paper. Resource limits on CPU, memory, network, and time inside each sandbox keep a runaway from spilling into shared infrastructure. And clean teardown matters more than it sounds: a sandbox that leaves residual state can compromise the isolation guarantees the next user's session depends on.
What observability looks like when orchestration and execution are split
Once planning and tool execution live in separate services, distributed tracing stops being optional. Without end-to-end trace correlation, whoever's on call has no way to find where a specific request got stuck, and "somewhere in the pipeline" isn't an answer anyone can act on.
A trace in a system like this needs to capture every tool call, its latency, how many times it retried, the queue time between the orchestrator handing off work and a worker actually picking it up, token usage per call, and the final outcome. That's a lot of surface area, but it's what makes the difference between debugging in minutes and debugging by guesswork.
Watch the 99th percentile latency, not the median. The median looks fine during an overload, right up until it doesn't, while the tail has already been climbing for a while. Watch queue depth relative to worker count. Watch error rate broken out by type, because rate-limit errors, tool errors, and model errors call for different responses and lumping them together hides which one is actually happening. And watch cost accumulation against expected spend, in something close to real time.
The semaphore and the queue, together, turn backpressure into something measurable. Queue depth growing while worker count stays flat is an early warning that capacity is running out, and it shows up before users notice anything is wrong. Keep tracking the provider's rate-limit headers, remaining requests, remaining tokens, on every response. It's the only reliable signal you get before a 429 actually lands. And run a stale-task recovery job alongside any semaphore: a hung task holds its slot until explicitly released, so without timeout enforcement the effective concurrency ceiling can erode in ways that aren't obvious until throughput stops adding up.
Choosing the right architecture for where your product actually is
These are configurations that require deliberate tuning rather than a default to copy on day one. It's a decision that follows from scale and reliability requirements, not something to build because it sounds thorough.
A single-process loop is the right call for internal tooling, a small customer base, tools that are fast and reliable, and a small team that owns the whole stack end to end. It's simpler to build, simpler to deploy, and dramatically simpler to debug when something breaks at 2 a.m.
The decoupled, queue-based architecture earns its complexity once traffic gets bursty across many tenants, tool calls start showing unpredictable latency, predictable tail latency across many concurrent sessions becomes a real requirement, or compliance demands the kind of auditability and isolation that a single process can't offer.
The path between those two points doesn't have to be a leap. Start with a semaphore and a budget kill switch, since that's low cost and high leverage on its own. Add a priority queue once interactive and batch workloads start competing for the same slots. Bring in the orchestrator-queue split once tool-call latency variance starts showing up where users can feel it. Build in that order, and the architecture grows with the actual problem instead of guessing at one that hasn't shown up yet.
Sources
- Resources | DebuggAI - Testing Guides and Best Practices
- AI Agent Rate Limiting Guide 2026: APIs & Budget Caps
- OpenAI API Agent Architecture: Production Design Patterns for 2026 | Markaicode
- AI Agents in Production: Agent Rate Limit Management | PADISO Blog
- AI Agent Tool Calling Architecture: Production System Design | Markaicode
- Multi-Agent Architecture: Production Coordination Guide | Markaicode
- Claude Code Architecture: Production Design for AI Agents | Markaicode